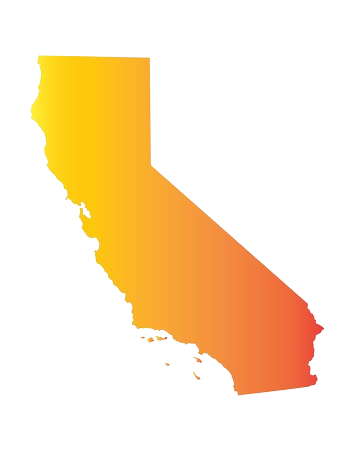
We put on our thinking caps and built a machine learning model that accurately showcases "Sol" in California based on vegetation and urban island heat influencing factors.
TLDR: Check for trees and building density around a specific location. Mix it in with temperatures and some special ML magic and you get a heat vulnerability score.
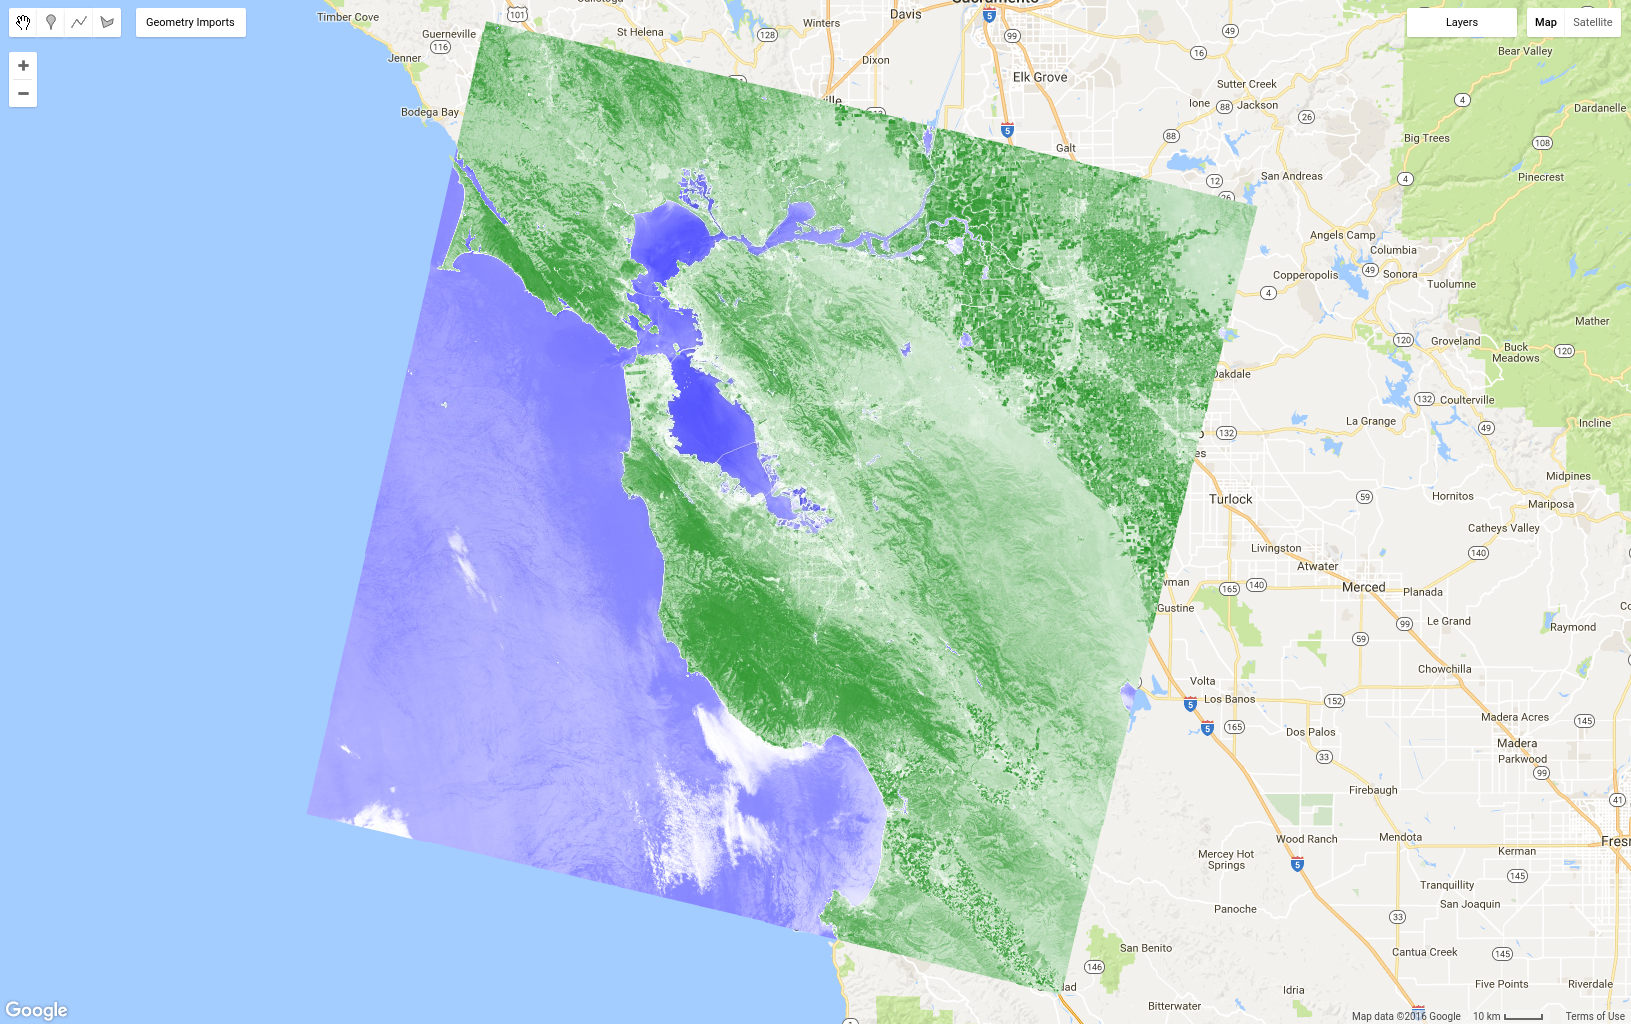
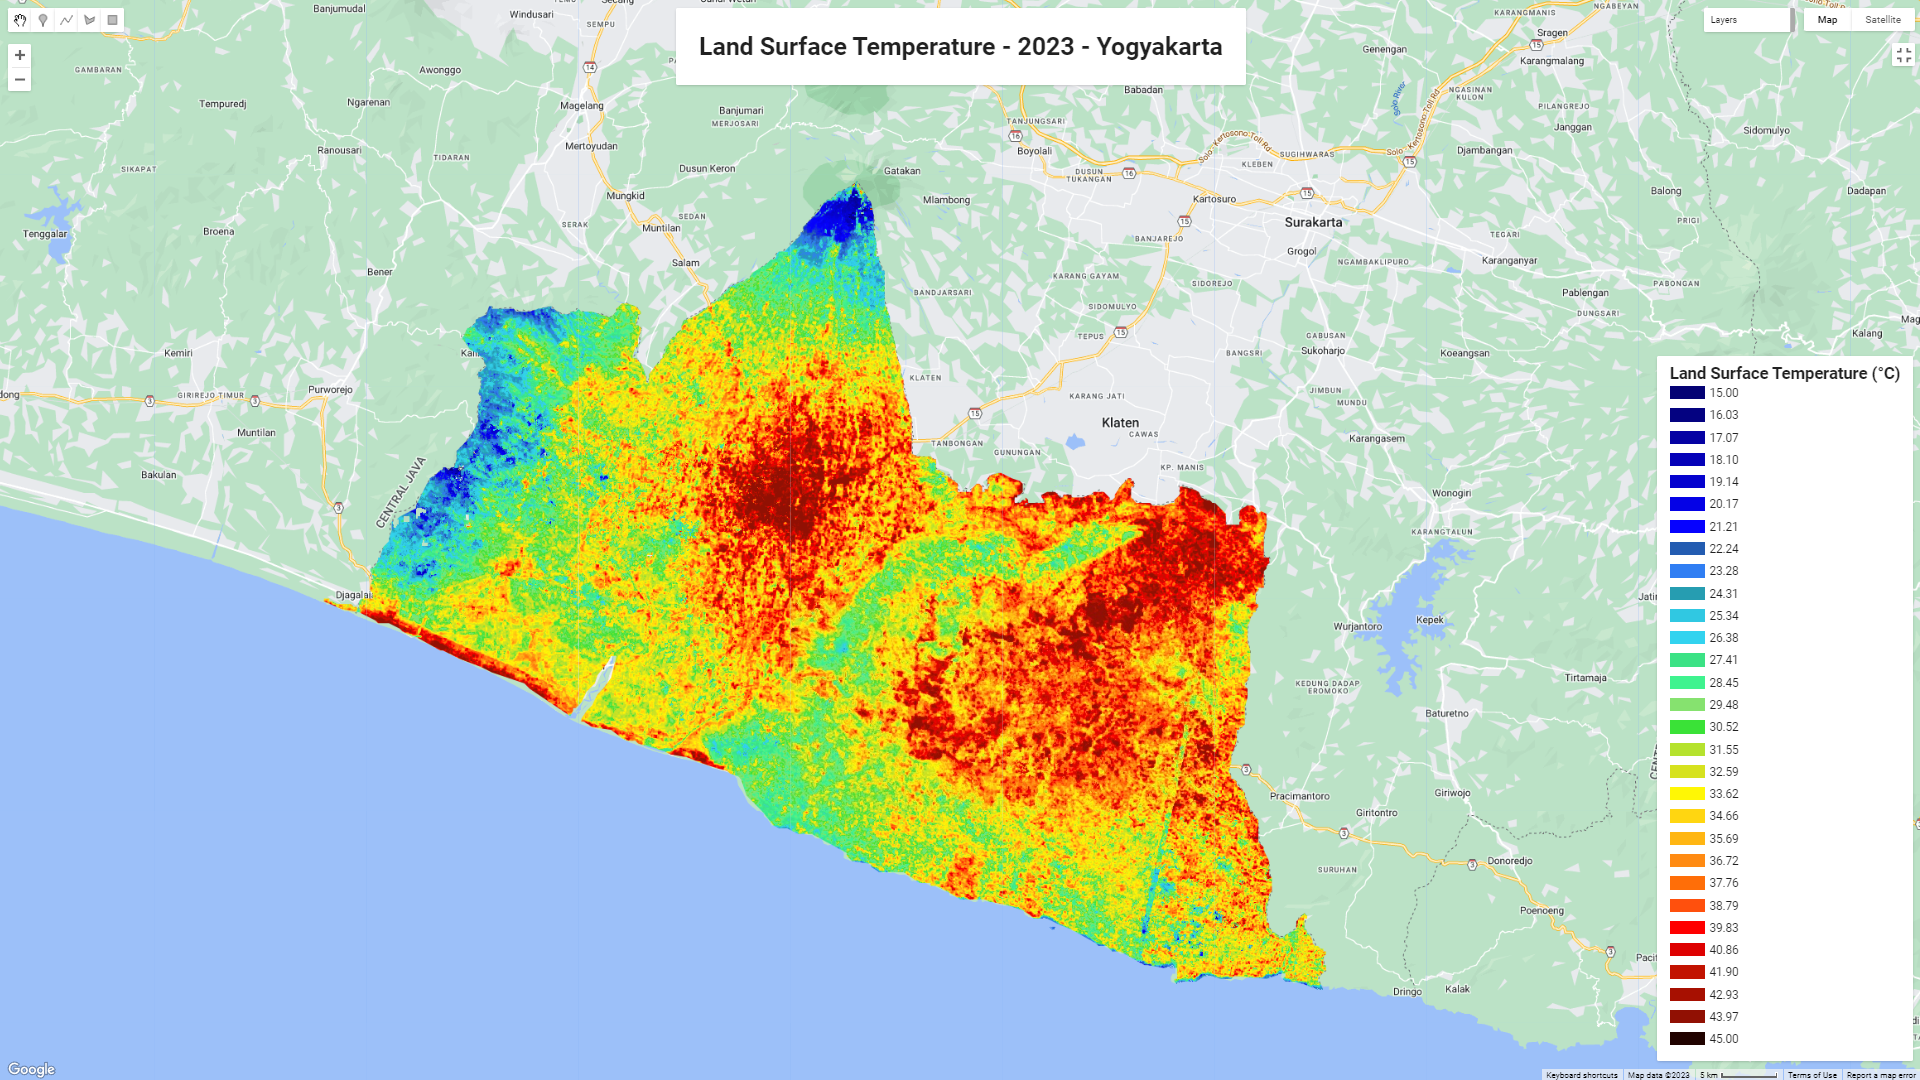
Both NDVI and LST rasters were exported directly from Google Earth Engine using Landsat 8/9 imagery for California.
Google Earth Rasterization of NDVI
NDVI raster shows vegetation health and density across California, with brighter areas indicating more vegetation.
Google Earth Rasterization of LST
LST raster shows land surface temperature across California, with brighter areas indicating higher temperatures (hotter urban heat islands).
*Notice how areas near the coast are darker, corresponding to cooler temperatures.
Machine Learning Model Dataframes
Machine Learning Model Dataframes
DataClassificationsforMLModel
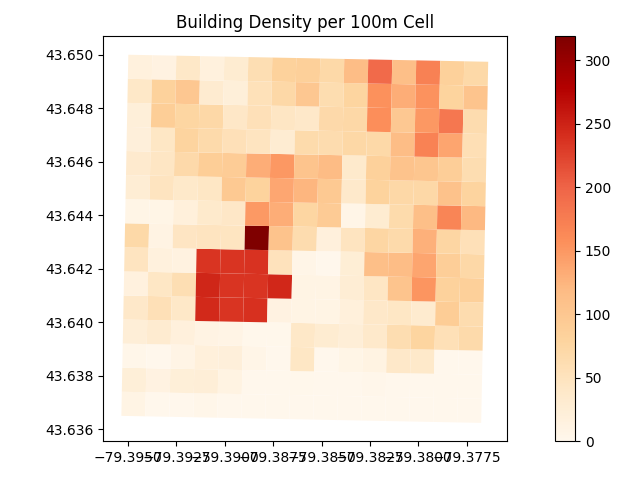
As part of feature extraction, we rasterized both building density and tree density into uniform 100 m grid cells across California. These become two of the three columns in our feature matrix X (the third being normalized temperature). We then fed X into our Random Forest, which learned how those spatial patterns combine to predict heat‐vulnerability scores.
Tree Density Raster
Each cell = 100m × 100m patch. Scattered green clusters correspond to urban tree canopy. The darkest cell peaks at 0.006 (density units).
In ML terms: Vegetation input (proxy for NDVI), normalized tree/vegetation cover per cell.
Building Density Raster
A concentrated urban cluster (center-left) reaches 300 m² of roof per 10,000 m² cell. Surrounding cells show moderate suburban density.
In ML terms: Urbanization input — m² of roof area per 10,000 m² cell.