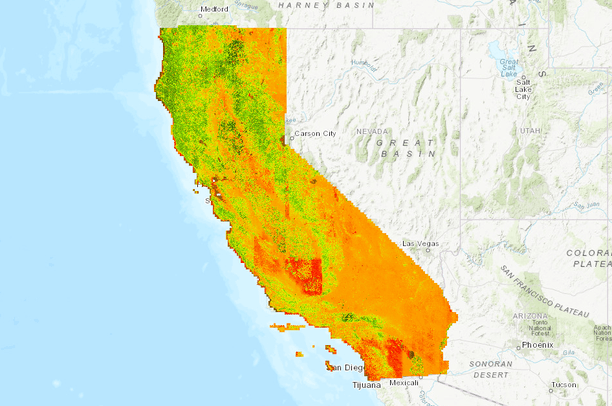
HeatHeatdoesn'tdoesn'tcarecarewherewhereyouyoulive.live.ButButitithitshitsharderharderininsomesomeplacesplacesthanthanothers.others.
0
premature deaths from non-optimal temperatures — every year.
Source: Lancet Planetary Health · Our World in Data
0
annual heat deaths
2023 estimate
+0%
increase since 1990s
heat mortality rate
0+
heatwave deaths in 2023
extreme events only
up to 0%
projected future increase
under climate change
Global Heat-Related Deaths (1990–2023)
Annual deaths from non-optimal temperatures (millions scale)
546,000
annual deaths from extreme heat (2023)
5 million
annual deaths from all non-optimal temperatures
+23%
increase in heat mortality rate since the 1990s
370%
projected increase under unmitigated climate change
Sources: Our World in Data · Lancet Planetary Health · CDC WONDER · PubMed Central · European Environment Agency
Heat-related mortality is rising in every region — driven by climate change, urban heat islands, aging populations, and unequal access to cooling. The elderly are disproportionately at risk, and heatwaves are now the deadliest extreme weather event in many countries. Sol exists to give communities the tools to fight back.
Ready to explore?
Dive into how we built it, or jump straight to the interactive map.